


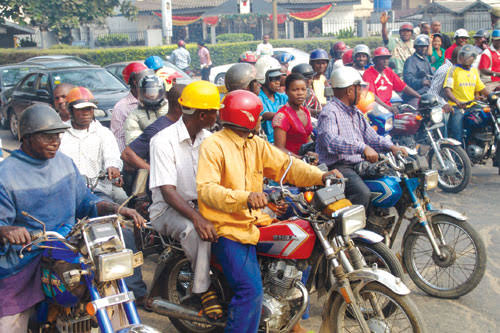
As Nigerians continue to battle with daily needs, the cost of transportation remains a critical aspect of their day-to-day activities. One of the most common and convenient modes of transportation, particularly for short distances, is the motorcycle, locally known as “okada.”
The National Bureau of Statistics (NBS) recently released data comparing the average prices of okada journeys per drop across the six geo-political zones of Nigeria in April 2023 and April 2024. This article explains the findings and explores the trends and possible implications of these changes.
Overview of the Data
The NBS data highlights the average prices per drop for okada journeys in April 2023 and April 2024 across Nigeria’s six geo-political zones. The percentage change over the year provides insight into the varying economic conditions and transportation dynamics within each zone.
| Geo-Political Zones | Average price (April 2023) | Average price (April 2024) | Percentage |
| NORTH CENTRAL | 528.96 | 452.86 | – 14.39 |
| NORTH EAST | 516.87 | 511.67 | – 1.01 |
| NORTH WEST. | 335.81 | 421.43 | 25.50 |
| SOUTH EAST | 480.14 | 470.00 | – 2.11 |
| SOUTH SOUTH | 405.97 | 485.00 | 19.47 |
| SOUTH WEST | 518.92 | 530.00 | 2.13 |
Regional Analysis
North Central
The North Central zone saw a notable decrease in the average price of okada journeys, dropping by 14.39% from ₦528.96 to ₦452.86. This substantial reduction could be attributed to improved transportation infrastructure, increased competition among riders, or economic policies aimed at reducing transportation costs.
North East
In the North East, the average price dropped marginally by 1.01%, from ₦516.87 to ₦511.67. This slight decrease suggests a relatively stable transportation cost environment, possibly reflecting modest improvements in security and infrastructure, which are critical in this region known for its challenges.
North West
Contrary to the trends in the North Central and North East, the North West experienced a significant increase of 25.50%, with prices rising from ₦335.81 to ₦421.43. This sharp rise could be due to increased demand, rising fuel costs, or economic pressures unique to the region.

South East
The South East saw a modest reduction of 2.11%, with prices falling from ₦480.14 to ₦470.00. This slight decline indicates minor improvements or stabilization in the factors affecting transportation costs.
South South
In the South-South, there was a noticeable increase of 19.47%, with prices climbing from ₦405.97 to ₦485.00. The rise in transportation costs in this oil-rich region might be linked to economic policies, changes in the local economy, or fluctuations in the cost of living.
South West
The South West, including Lagos, Nigeria’s economic hub, experienced a minor increase of 2.13%, from ₦518.92 to ₦530.00. This slight rise suggests a relatively stable economic environment with minor adjustments in transportation costs.
Conclusion
The NBS data provides a crucial snapshot of how transportation costs are evolving across Nigeria. Understanding these trends is vital for policymakers, businesses, and residents as they navigate the complexities of transportation and economic development in the country. Continued monitoring and targeted interventions could help manage these costs, ensuring more affordable and efficient transportation for all Nigerians.

